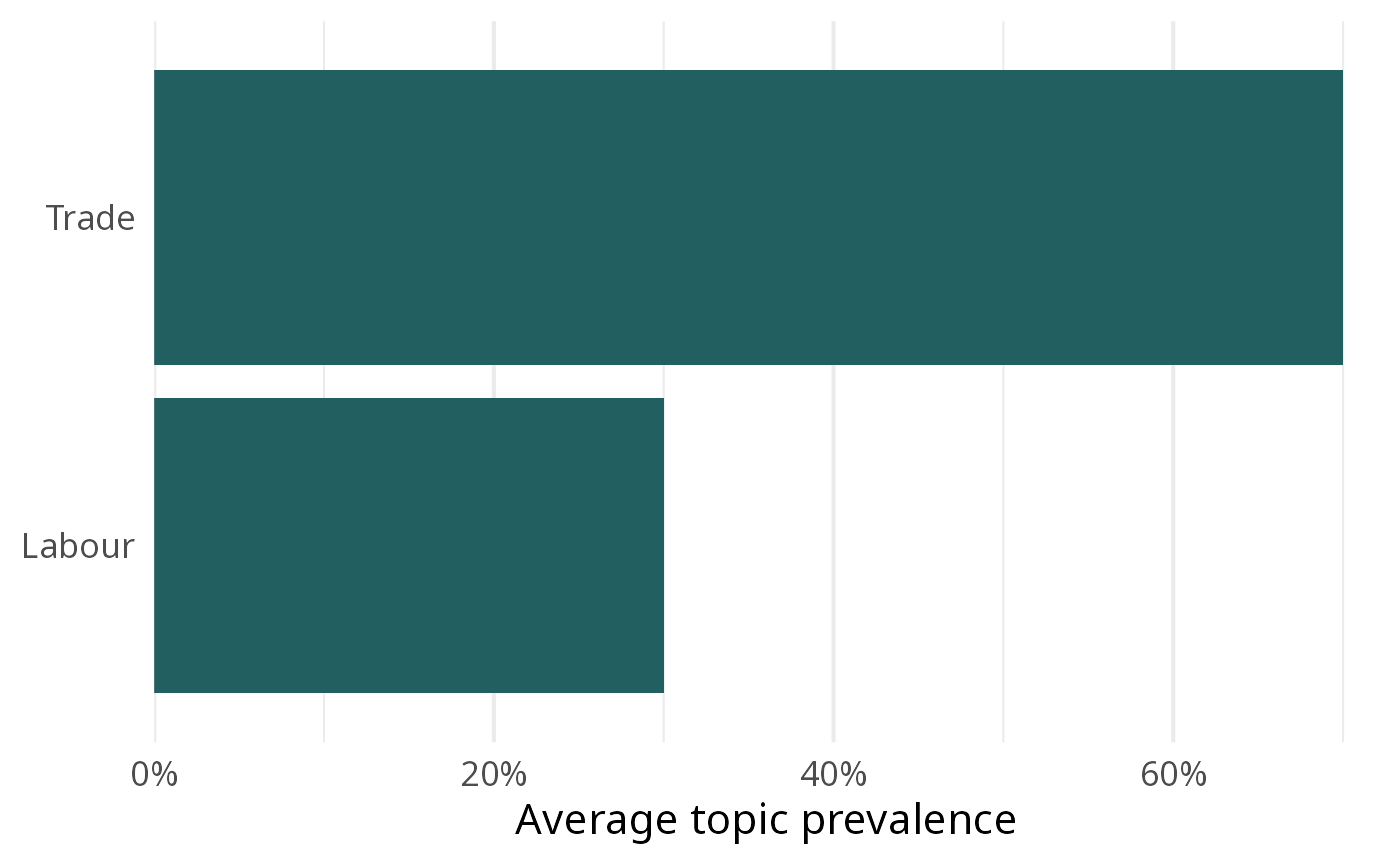
Average topic prevalence of an STM model
Source:R/topic_prevalence_plots.R
plot_topic_prevalence.RdMean of each topic's proportion over documents (\(\bar\theta_k = \frac{1}{D}\sum_d \theta_{dk}\)), drawn as a horizontal bar chart sorted by prevalence.
Usage
plot_topic_prevalence(
  model,
  topic_labels = NULL,
  base_size = 16,
  fill = scico::scico(1, palette = "batlow", begin = 0.25),
  ...
)
Arguments
- model
A fitted
stmmodel (onlythetais used), or its document-topic matrix.- topic_labels
Optional table with
topicandlabel(e.g. fromtopic_labels()ortopic_summary()).NULLlabels topics by their number.- base_size
Numeric scalar, base font size of the theme.
- fill
Bar colour.
- ...
Not used: an argument renamed in the development version of mintR gives an error naming its replacement.
Value
A ggplot. Its data (plot$data) is a data.table with topic,
prevalence and label. Save it with ggplot2::ggsave().
Examples
model <- list(theta = matrix(c(0.2, 0.8, 0.4, 0.6), nrow = 2, byrow = TRUE))
labels <- data.frame(topic = 1:2, label = c("Labour", "Trade"))
plot_topic_prevalence(model, labels)