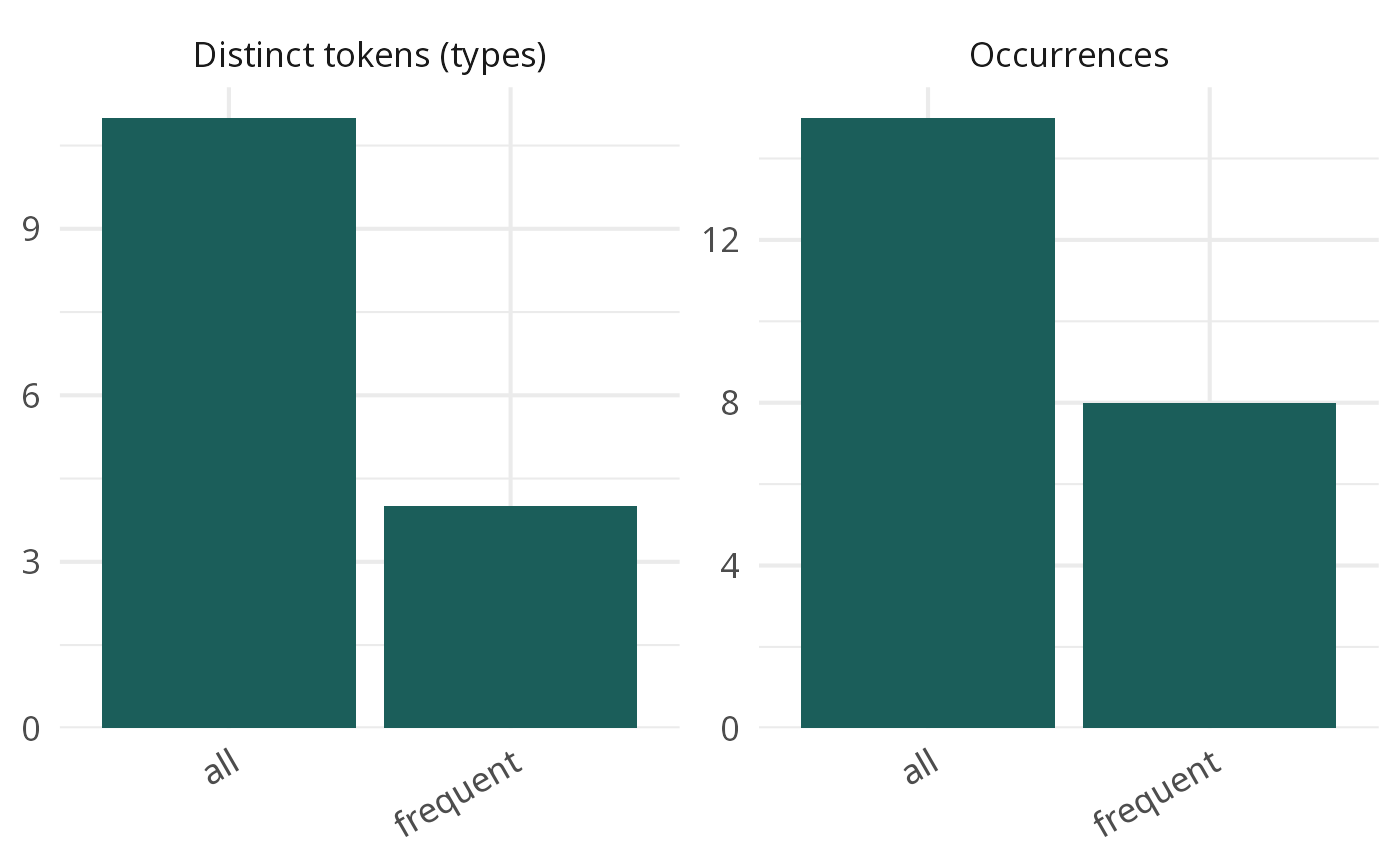
Plot what each filtering step removes
Source:R/vocabulary_diagnostics.R
plot_vocabulary_diagnostics.RdBars of the number (or share) of types and of occurrences
that remain after each step, from vocabulary_diagnostics().
Arguments
- diagnostics
Output of
vocabulary_diagnostics().Logical scalar: plot the share of the first step instead of the counts.
- base_size
Numeric scalar, base font size.
- ...
Not used: an argument renamed in the development version of mintR gives an error naming its replacement.
Value
A ggplot (the plotted table is its data), with a facet for types
and one for occurrences, and for each value of by if there is one.
Examples
tokens <- extract_ngrams(
  data.frame(id = 1:3, text = c(
    "labour market reform", "labour market policy", "monetary policy rule"
  )),
  ngrams = 2L, document_col = "id"
)
frequent <- tokens[token %in% tokens[, .N, by = token][N >= 2, token]]
plot_vocabulary_diagnostics(vocabulary_diagnostics(list(all = tokens, frequent = frequent)))