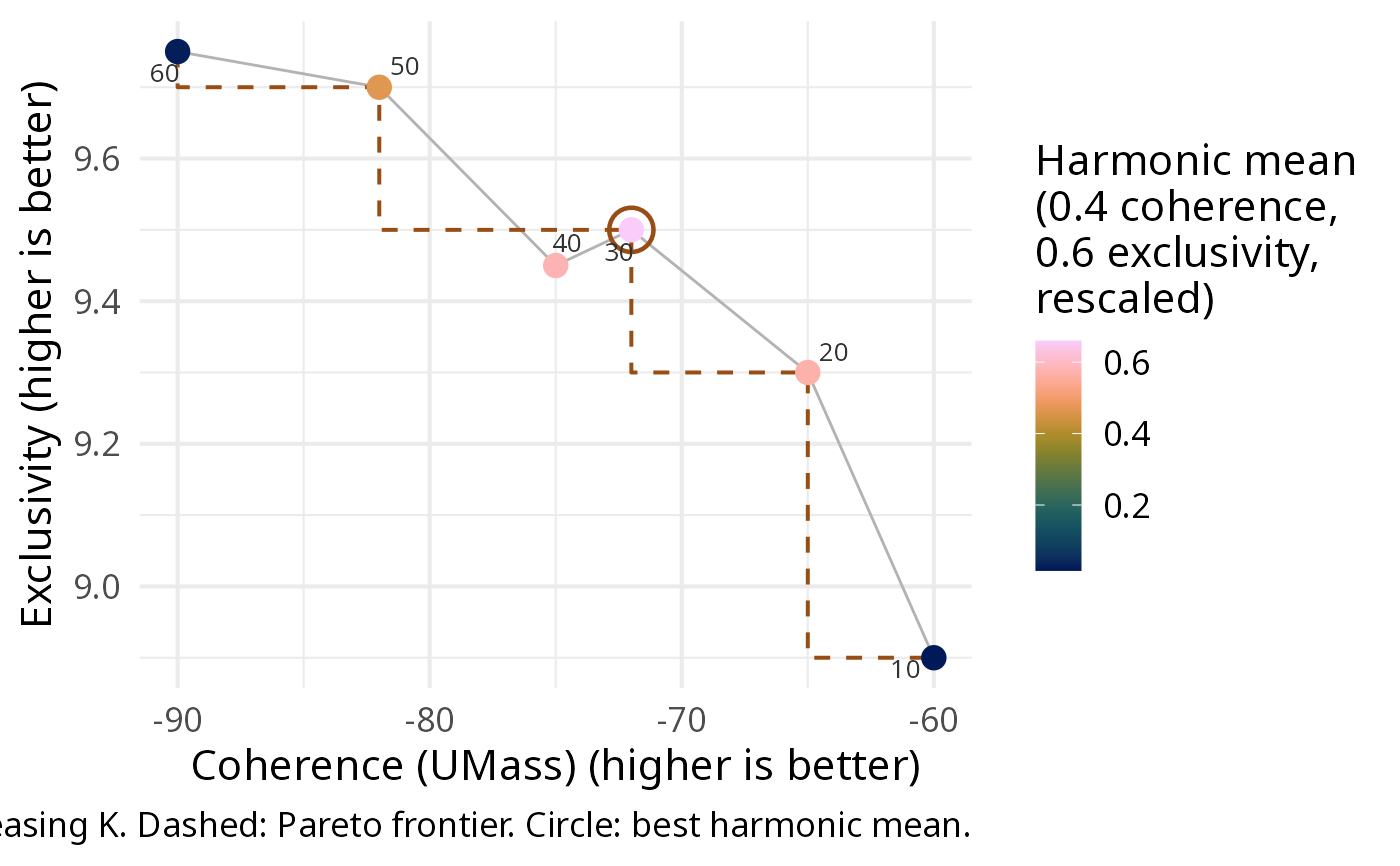
Coherence-exclusivity frontier of a grid of topic models
Source:R/model_selection.R
plot_k_frontier.RdPlace each model in the coherence x exclusivity plane, join
the models in order of K, draw the Pareto frontier (pareto_frontier():
only these models are worth considering), colour the points by the
weighted harmonic mean of the two criteria
(coherence_exclusivity_score()) and circle the best model. With
several corpora (vocabulary filters), one panel per corpus.
Coherence favours few broad topics and exclusivity many narrow ones, so no K maximises both (Roberts et al. 2014): the frontier shows the trade-off, the weights say how much each criterion matters to you.
Usage
plot_k_frontier(
  x,
  coherence = "coherence_umass",
  exclusivity = "exclusivity",
  k = "K",
  by = NULL,
  weights = c(0.4, 0.6),
  rescale = TRUE,
  base_size = 16,
  palette = "batlow",
  ...
)
Arguments
- x
A
topic_model_evaluation(evaluate_topic_models()), or a table with one row per model (e.g.stm::searchK()$results). Runs are averaged.- coherence, exclusivity, k
Column names of the coherence, the exclusivity and the number of topics.
- by
Column name(s) of the grouping (one panel each). Default:
"corpus"when there are several corpora.- weights, rescale
Passed to
coherence_exclusivity_score().- base_size
Numeric scalar, base font size of the theme.
- palette
A continuous scico palette for the score.
- ...
Not used: an argument renamed in the development version of mintR gives an error naming its replacement.
References
Roberts, M. E., Stewart, B. M., Tingley, D., Lucas, C., Leder-Luis, J., Gadarian, S. K., Albertson, B. and Rand, D. G. (2014). Structural topic models for open-ended survey responses. American Journal of Political Science, 58(4), 1064-1082. doi:10.1111/ajps.12103
Examples
results <- data.frame(
  K = seq(10, 60, 10),
  coherence_umass = c(-60, -65, -72, -75, -82, -90),
  exclusivity = c(8.9, 9.3, 9.5, 9.45, 9.7, 9.75)
)
plot_k_frontier(results)