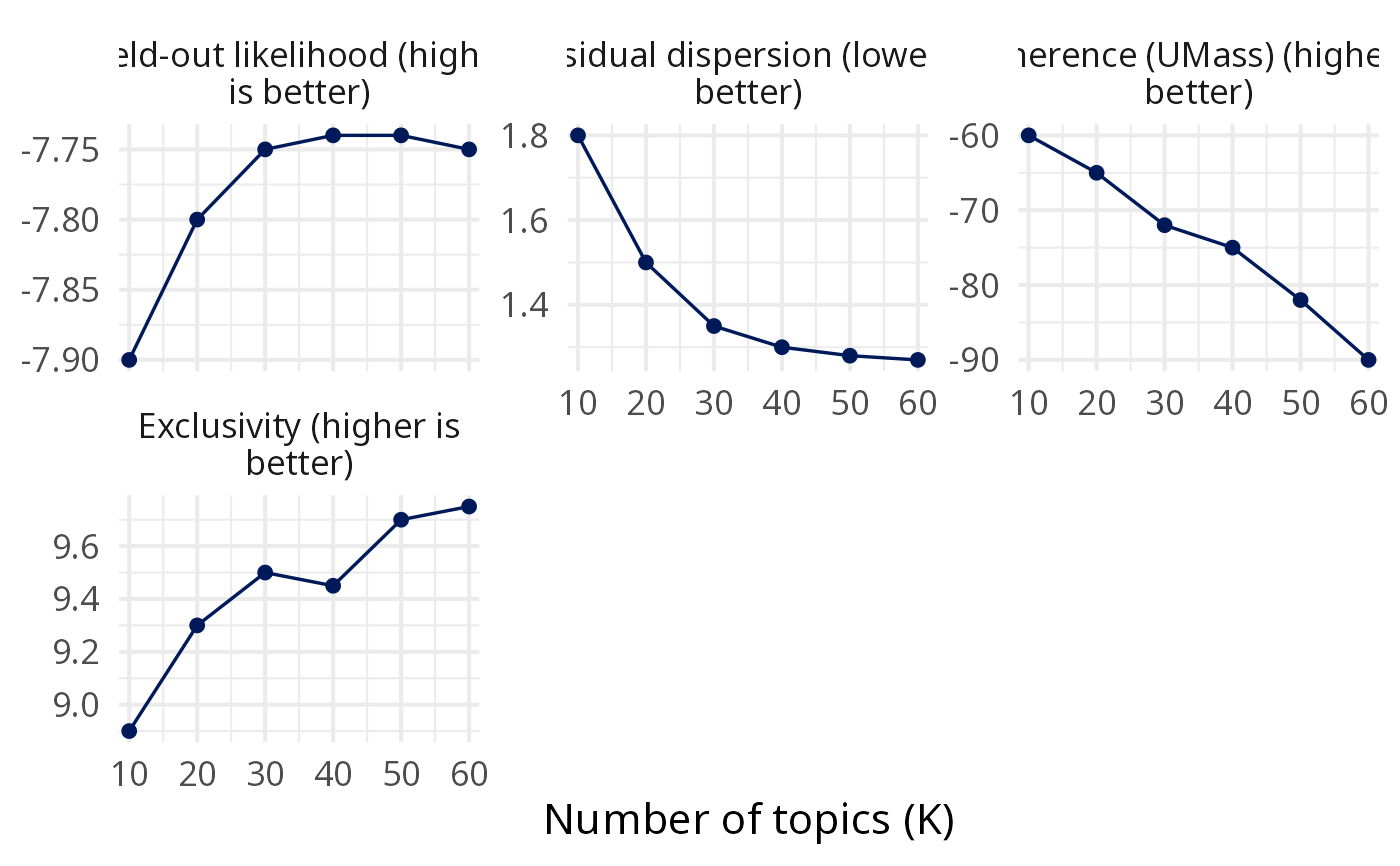
Metrics of a topic model evaluation by number of topics
Source:R/model_selection.R
plot_model_metrics.RdOne panel per metric, K on the x axis, one line per corpus
(mean over runs, with the runs as points). The panel titles say whether
higher or lower is better. Look for where held-out likelihood and
residuals level off, where coherence starts to fall and diversity to
drop, then read the coherence-exclusivity trade-off with
plot_k_frontier().
Arguments
- x
A
topic_model_evaluation(evaluate_topic_models()), or a table with one row per model (e.g.stm::searchK()$results).- metrics
Character vector of metric columns to draw. Default: all available.
- ncol
Number of panel columns.
- base_size
Numeric scalar, base font size of the theme.
- ...
Not used: an argument renamed in the development version of mintR gives an error naming its replacement.